From Text to Knowledge Graph
This short article will start by giving a brief explanation on what is a knowledge graph and how it can be used in the context of RAG…
This short article will start by giving a brief explanation on what is a knowledge graph and how it can be used in the context of RAG (Retrieval-Augmented Generation). Then it will give you indications about how to build your own text to knowledge graph image generator.
First, what is a knowledge graph?
It is a kind of knowledge base that focus on storing the relationships between concepts.
But as we say in France, “une image parle plus que des mots” (a picture speaks louder than words).
So let’s start by creating a knowledge graph from… the wikipedia article about a knowledge graph …
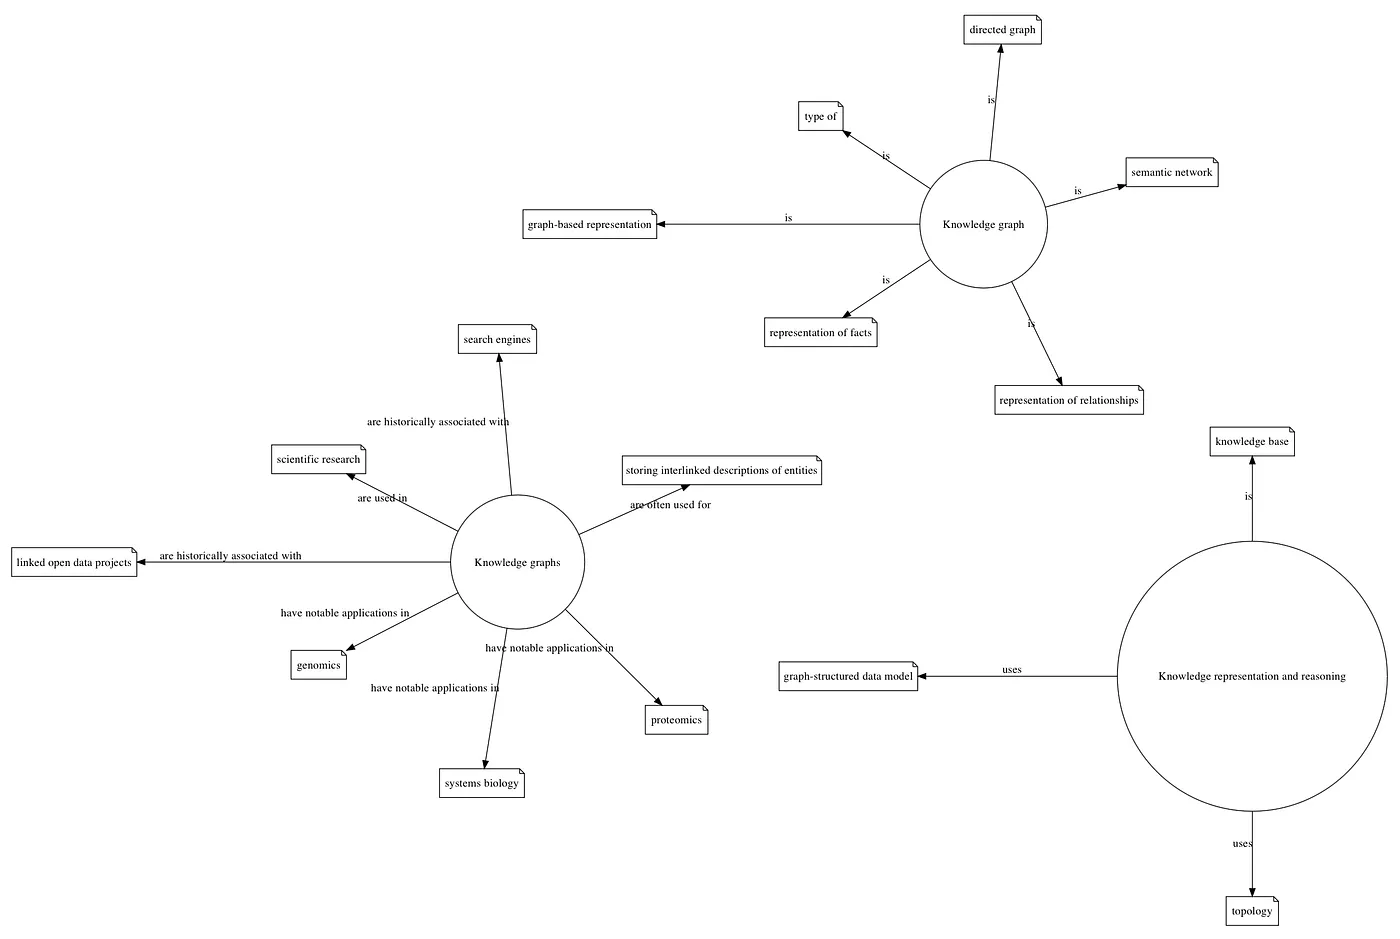
Knowledge graph of the first part of the wikipedia article.
On the graph we can see the different concepts and the links between them.
So to summarize a knowledge graph is a structured representation of concepts and their relationships. It is based on directed graphs and can be used to build search engines but they can also be used for scientific research, particularly in biology and genomics.
Working with a large text
We will now display a biggest knowledge graph, constructing from Nelson’s Mandela statement “An Ideal for Which I am Prepared to Die”
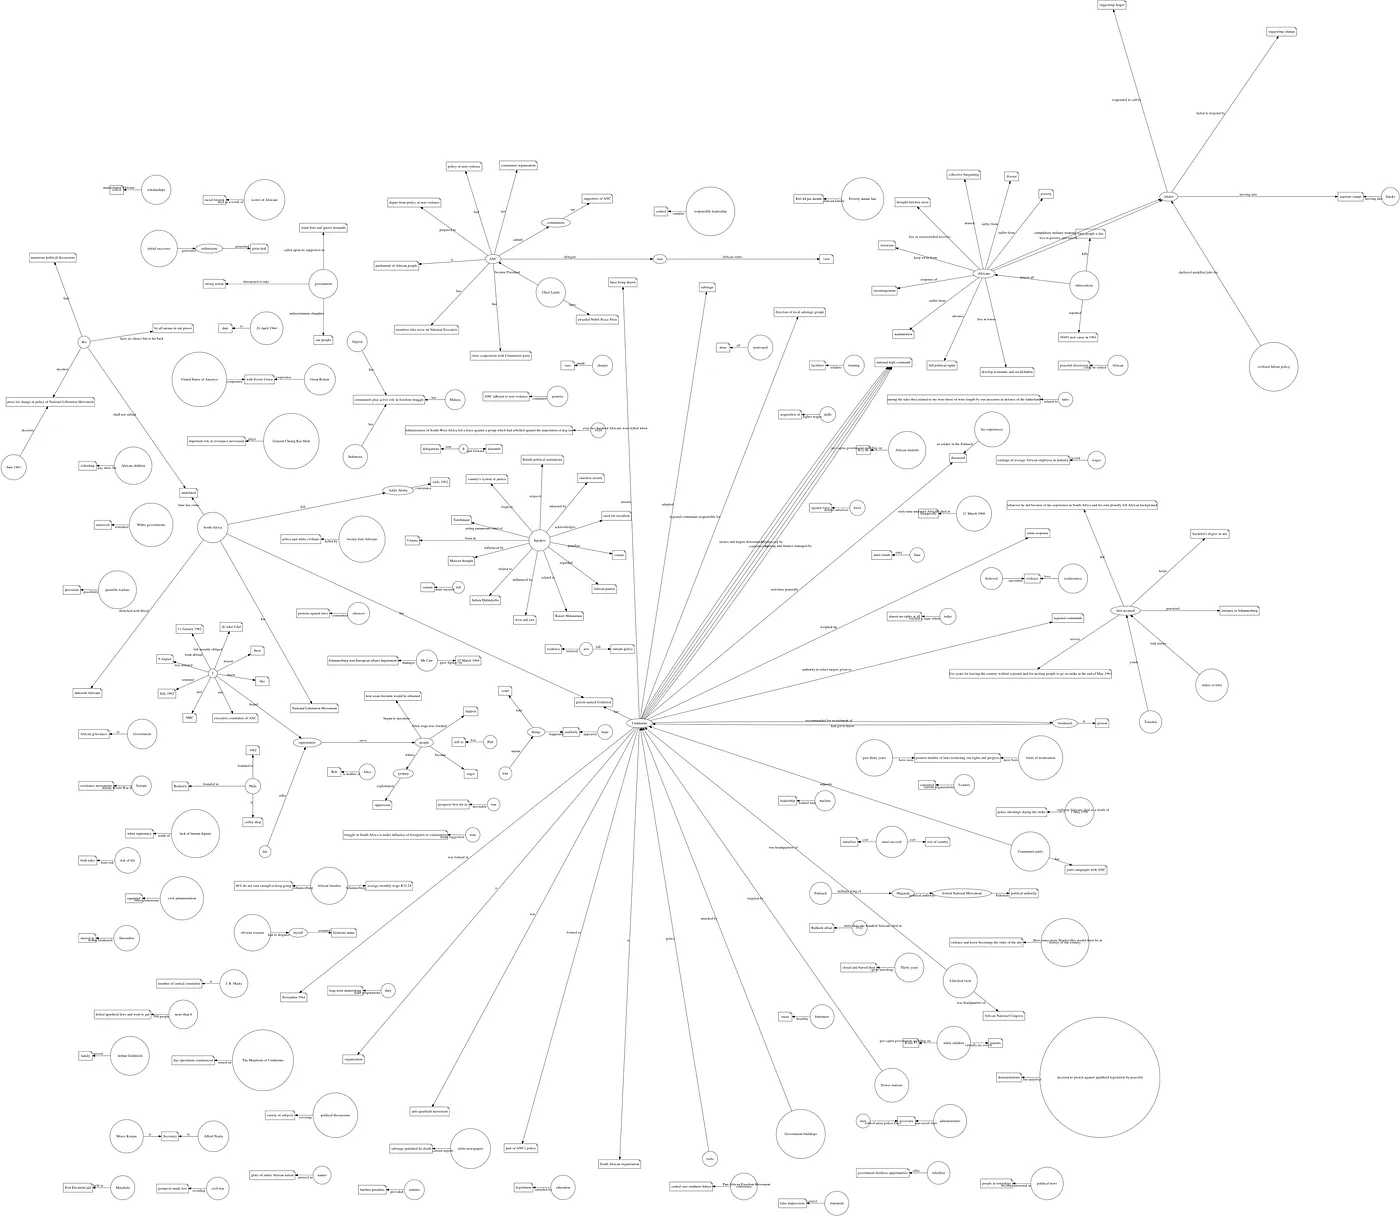
A big knowledge graph built from a large text.
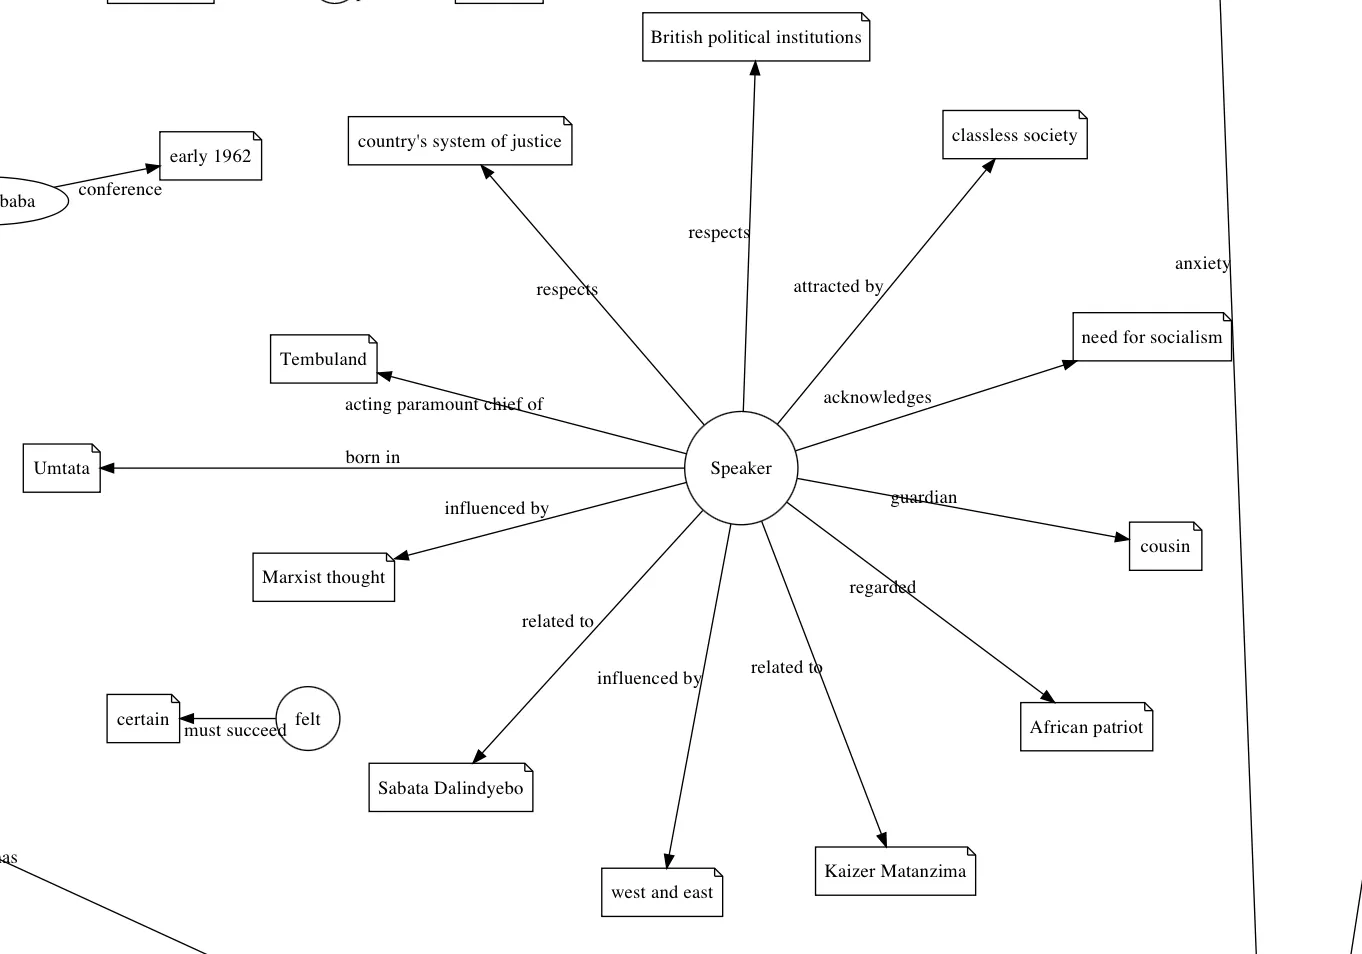
Zoom in on the part of the graph that indicates knowledge extracted about the speaker.
After having created a knowledge graph from a large text, we can easily get access to all knowledges about a subject (here the speaker) even if they were in different parts of the text.
In the context of Retrieval-Augmented Generation?
Although they are more difficult to implement than semantic or full-text (or hybrid) search (both at indexing and querying time), a knowledge base based retriever can bring great results in the context of RAG.
Indeed they help to provide a generation context that only contains facts about the expected subject instead of providing chunks of text that we hope will provide relevant information (but will also often contain other data not useful to answer the question)
How I constructed the illustrations for this article?
First part, extracting the triplets
My source code is based on source code from llamaindex for those kind of tasks.
- A SemanticSplitterNodeParser used to split a text into smaller chunks of sentences that are semantically closed.
- A locally run LLM LlamaCPP (I won’t give the name of the model I use as I tried multiple and haven’t finished yet to benchmark the one that give the best results for this task) used with a prompt taken from LlamaIndex asking to extract triplets from a text.
- A code to extract triplets from the LLM prediction (based on the code from LlamaIndex)
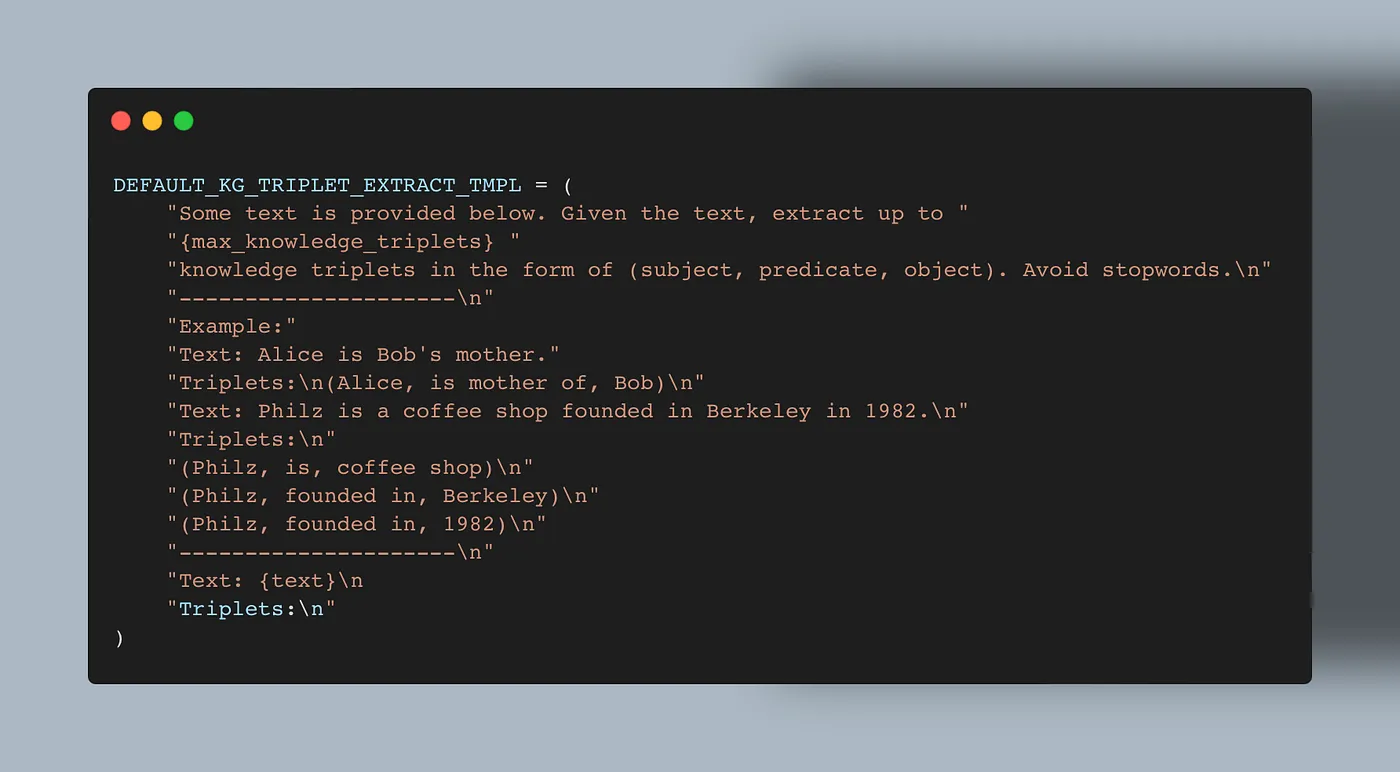
Extract of llamaindex source code: the prompt to extract triplets.
Second part, generating the image
- A code to convert the triplets into DOT language (graphviz). (I shape root nodes as circles, leaves as “note” and other nodes as oval)
- A way to render the DOT language into an image (I use the graphviz-react npm module on the front-end of my application to display it as a SVG, and pydot when I need it to be rendered on the back-end (to get a .png))
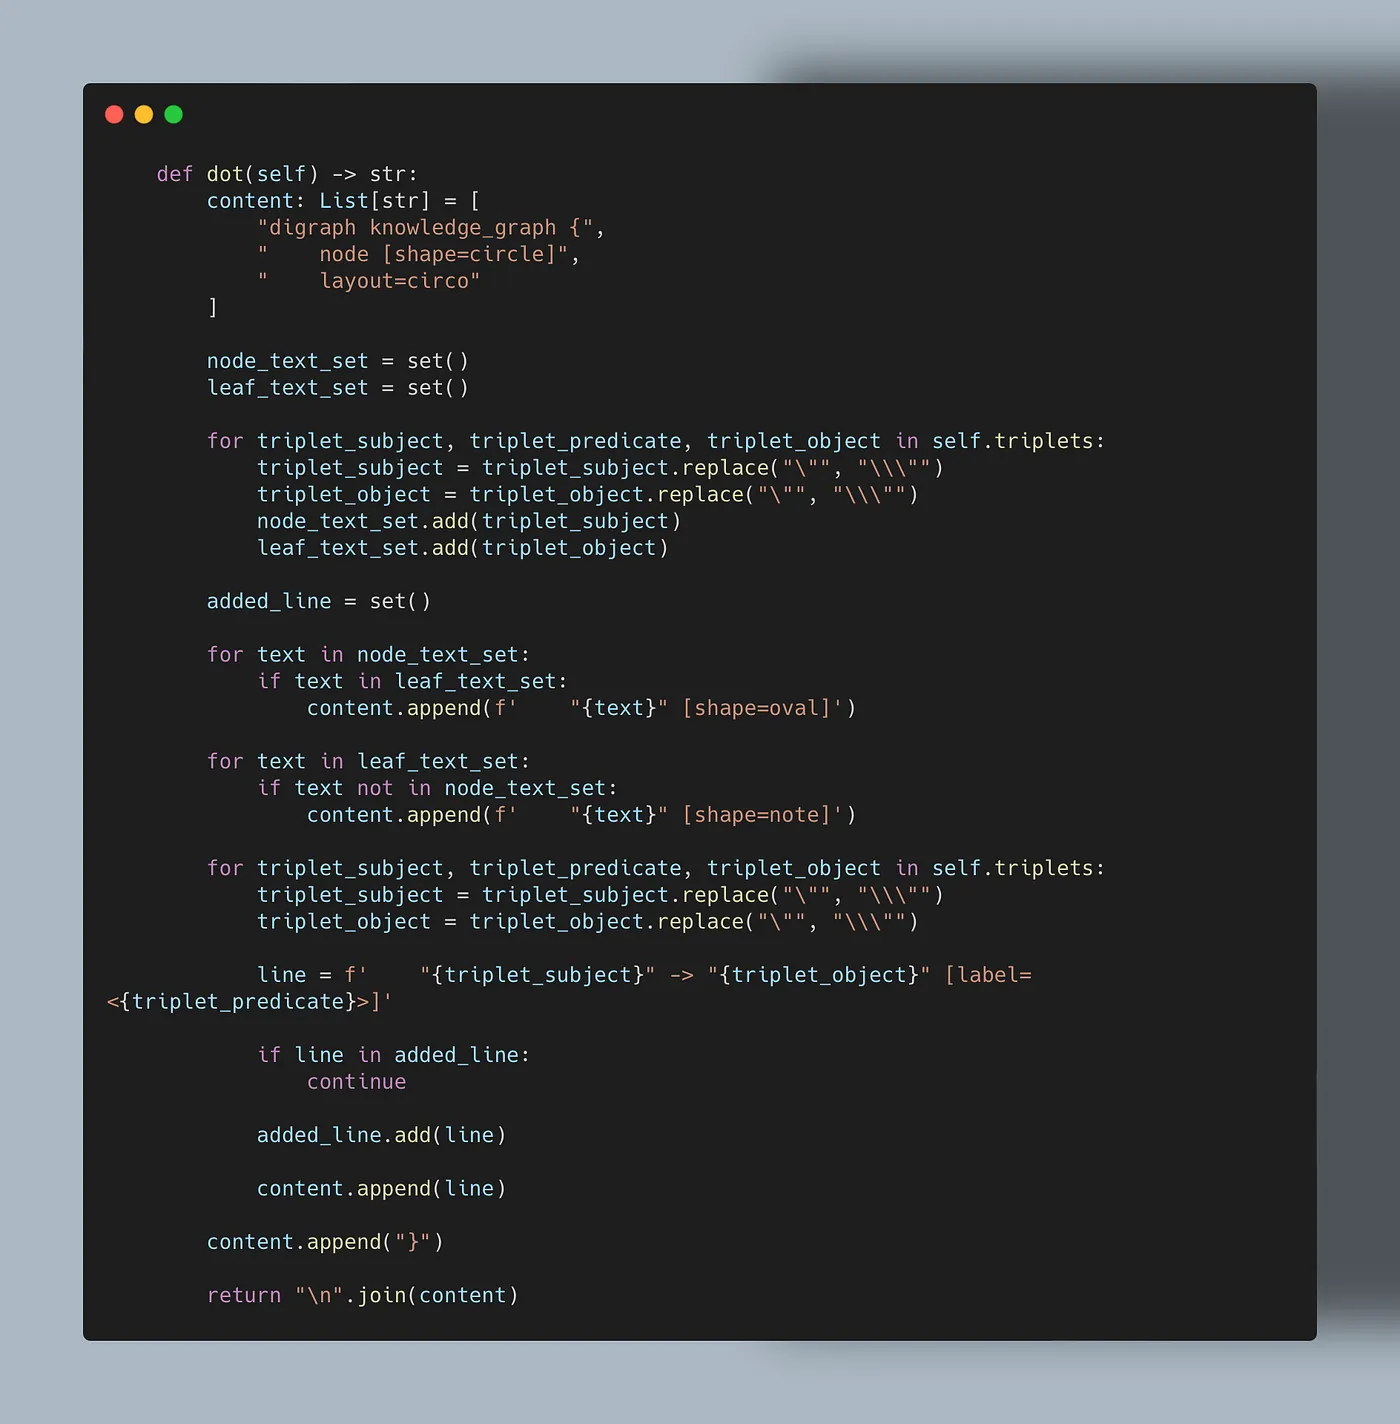
Extract from my own source-code. The construction of the DOT language graph representation.
As for now I am using Graphviz’s DOT language mostly because I have been using it for a long time and it is very easy to use and fast to integrate. I might change it in the future.
That’s all folks!
I hope it will have help you to understand the benefits of knowledge graphs.