AI wrote the code. Who profiles it?
AI agents write most of my frontend code now, and it is magnificently unoptimized. No prompt makes an agent measure what it has no instrument for, so I gave it a measurement loop: react-scan, render time, and numbers in every commit.
AI agents write most of my frontend code now. Not because they are fast. They are not, sometimes slower than me, but they keep shipping while I do something else. On personal projects that is everything: without it, I would never find the time. The code compiles, the structure is fine, and it is magnificently unoptimized. Not stupid, not malicious: just nobody asked.
Three things AI-generated React does by default, all from my pages:
- re-renders the whole list on every poll, because the merge compares a field the server recomputes on every fetch;
- a smooth scroll-to-bottom and a virtualizer fighting each other forever;
- confident perf “audits”: “memoize X, saves 17k renders”, false, or already fixed, or both.
Why intuition and monitoring fail
A re-render storm is not an error, so Sentry stays silent. The app works, it just works 4,000 times per window for nothing.
The agent’s intuition fails the same way mine did, only faster. My early perf audits were agent audits, and the pages really were slow: the agent produced confident attributions like “memoize X, saves 17k renders” whose premises were false or already fixed. It does not measure, it pattern-matches, because it has read ten thousand blog posts about useMemo while having profiled zero components. The reality: no prompt makes an agent measure what it has no instrument for.
The thesis: AI-generated code needs a measurement loop the AI itself can run — measure → fix one cause → re-measure → commit with numbers. Without numbers the agent is just hypothesizing, and an unmeasured fix can make the page slower than the bug.
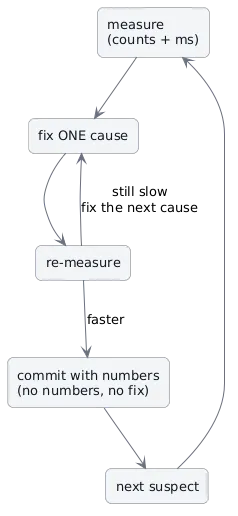
Figure 1. The measurement loop. A fix ships only with numbers; “still slow” means the next cause, not a smarter prompt.
The loop
Dev-only react-scan: @react-scan/vite-plugin-react-scan attached only when command === "serve", so vite build stays byte-identical. In vite.config.ts it looks like this:
// vite.config.ts — dev server only; SCAN=false opts out even in dev
const scanEnabled = process.env.SCAN !== "false";

export default defineConfig(({ command }) => ({
  plugins: [
    react(),
    ...(command === "serve" && scanEnabled
      ? [reactScanPlugin({ enable: true, scanOptions: { enabled: false } })]
      : []),
  ],
}));Warning: the profiler must NEVER reach production. Do not assume the gate works, verify the build is clean:
grep -c ReactScanInternals dist/assets/*.jsmust return 0. That grep is the only thing standing between you and a react-scan in production.
The headless probe is one small middleware the agent wrote for itself, on my instruction, because react-scan offers no “armed but silent” state: the inspect UI hijacks the app, while switching it off detaches the hook. A serve-only Vite plugin serves a module that arms the hook and keeps it reachable:
// vite.config.ts — same serve-only gate as the plugin above
{
  name: "dev-react-scan-probe",
  apply: "serve",
  configureServer(server) {
    server.middlewares.use((req, res, next) => {
      if (req.url === "/dev-probe.js") {
        res.setHeader("Content-Type", "text/javascript");
        res.end(
          "import * as rs from '/@id/react-scan';\n" +
            "window.__perfScan = rs;\n" +
            "// keep the hook attached: scan() installs it, then flip\n" +
            "// the option off so no overlay/toolbar renders.\n" +
            "rs.scan({ enabled: true, showToolbar: false });\n" +
            "rs.setOptions({ enabled: false });\n",
        );
        return;
      }
      next();
    });
  },
}
That is the whole probe: five lines of JavaScript served by a plugin that only exists in vite serve. The timing source is fiber.actualDuration, React’s own profiling clock. One subtlety: onRender fires inside onCommitFiberRoot before React swaps the double-buffer, so pick the alternate with the later actualStartTime or your ms silently reads 0.
Maestri, for those who don’t know it, is a canvas where I work with AI agents. One of its features is the portal: a real browser tab I can link to an agent, so the agent can see the website it is editing, not just read the code it wrote.
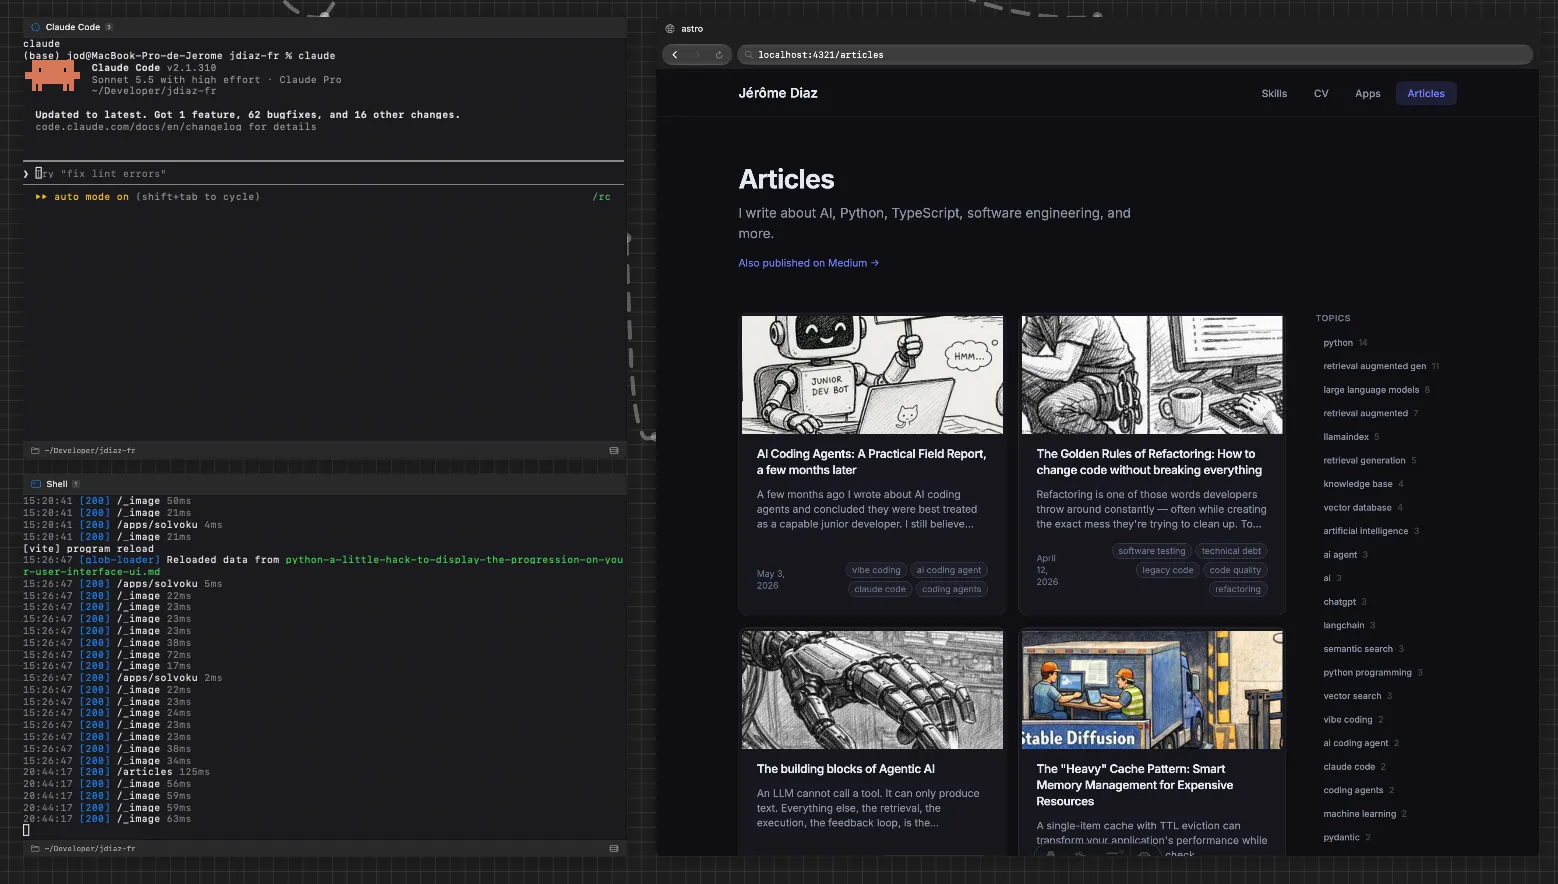
The driver is Maestri’s portal: a real, visible, scriptable tab. The trap: react-scan callbacks go inert in hidden tabs (document.hidden), so a headless Playwright run can lie to you with beautiful confidence. The tab must be visible.
The full arming JS lives inside the first evaluate of measure.sh, the script that is the loop: it navigates, arms the probe (fire-and-forget, portal evaluate does not await promises, so poll window.__perfArmed), sleeps WINDOW, and prints one JSON line.
#!/bin/zsh
# measure.sh <label> [window-seconds] — page-open render measurement.
# Reloads TARGET_URL in the Maestri portal, arms react-scan headless
# (via the serve-only /dev-probe.js middleware), counts commits/renders
# AND sums render time (fiber.actualDuration, latest-alternate guard) for
# WINDOW seconds, prints one JSON line (msTotal, msSelfTotal, topMsSelf).
#
# Adapt the browser driver (maestri portal evaluate) to playwright/CDP
# if no Maestri portal is available. The arming JS is the portable part.
#
# Three windows to measure per fix:
#   open sequence  -> run right after navigate (this script)
#   steady idle    -> arm WITHOUT navigating on a settled page; healthy = 0/0
#   repeat         -> run 2-3x; first run may include login warm-up
LABEL="${1:-meas}"
WINDOW="${2:-12}"
TARGET_URL="${TARGET_URL:-http://localhost:5173/admin/}"
P="${PORTAL:-Frontend}"

maestri portal navigate "$P" "$TARGET_URL" >/dev/null
sleep 1
# Fire-and-forget: portal evaluate does NOT await promises — the arming
# promise resolves later; poll window.__perfArmed=='ok' before the window
# starts. (Playwright/CDP page.evaluate awaits natively and needs neither.)
maestri portal evaluate "$P" "window.__perfArmed='pending'; import('/dev-probe.js').then(function(){var rs=window.__perfScan; window.__perfC={commits:0,renders:0,byName:{},ms:{},msSelf:{}}; rs.setOptions({enabled:true,showToolbar:false,onCommitStart:function(){window.__perfC.commits++;},onRender:function(fiber,renders){var t=fiber&&fiber.type; var n=(t&&(t.name||t.displayName))||(typeof t==='string'?t:'?'); var c=(renders&&renders.length)||1; window.__perfC.renders+=c; window.__perfC.byName[n]=(window.__perfC.byName[n]||0)+c; var a=fiber.alternate; var latest=(a&&a.actualStartTime&&fiber.actualStartTime&&a.actualStartTime>fiber.actualStartTime)?a:fiber; var total=latest.actualDuration||0; window.__perfC.ms[n]=(window.__perfC.ms[n]||0)+total; var self=total,ch=latest.child; while(ch){self-=ch.actualDuration||0;ch=ch.sibling;} window.__perfC.msSelf[n]=(window.__perfC.msSelf[n]||0)+Math.max(self,0);}}); window.__perfArmed='ok';})['catch'](function(e){window.__perfArmed='err:'+e.message;}); 'started'" >/dev/null
sleep "$WINDOW"
maestri portal evaluate "$P" "(function(){if(window.__perfScan)window.__perfScan.setOptions({enabled:false}); var c=window.__perfC||{}; var top=Object.entries(c.byName||{}).sort(function(a,b){return b[1]-a[1]}).slice(0,8); var sum=function(o){return Object.values(o||{}).reduce(function(a,b){return a+b},0)}; var topMs=Object.entries(c.msSelf||{}).sort(function(a,b){return b[1]-a[1]}).slice(0,8).map(function(e){return [e[0],Math.round(e[1]*100)/100]}); return JSON.stringify({label:'$LABEL',hidden:document.hidden,commits:c.commits,renders:c.renders,msTotal:Math.round(sum(c.ms)*100)/100,msSelfTotal:Math.round(sum(c.msSelf)*100)/100,top:top,topMsSelf:topMs})})()"
Three windows per fix: open / steady idle / repeat. Healthy idle = 0 renders / 0 commits; nonzero idle is a bug. Validity gates: force an interaction and confirm the counters moved, check document.hidden, confirm some msSelf > 0 (dev builds only). NB: the msSelf > 0 gate only means something in a dev build. And the overlay keeps ~120-160 RAF/s alive once armed, so any RAF spy must be armed BEFORE the probe.
One rule inside the loop
Counts screen, milliseconds pass the verdict. Counts are cheap and near-deterministic: they find who is busy, never how much it costs.
Memoization (ie: memo(), useMemo, deep-compares) is not free. For cheap leaves the compare can exceed the render it skips: renders drop, ms stays flat or goes up, and a count-only dashboard cheers. Judge a fix by the change in render time (the milliseconds the probe says React itself spent rendering): a fix that cuts renders but not ms is not a fix.
Case 1: the chat page that never stopped
AI-generated chat page, 1,254-message history. Before: 4,236 renders / 28 commits per 12s idle, a RAF wake-loop of 764-1,208 per window with zero scroll events — the page fighting itself at a hundred frames a second, stuck 85,410px from its own bottom.
Root cause, one line: the virtualizer’s default top-anchoring plus flushSync-on-measure fighting the smooth scroll-to-bottom. The AI wrote the scroll and the AI wrote the virtualizer, and nobody asked whether they liked each other. They do not.
Fix, 26 lines: anchorTo:"end" + followOnAppend:"auto" + useFlushSync:false. After: steady idle 0 commits / 0 renders, page opens at the bottom. Honest caveat: the open window moved 2,749ms to ~2,533ms, and the after-counts are HIGHER because the healthy build finally mounts the bottom window the broken build never reached. The “worse” number is the healthy one.
Case 2: the 30-second wave
Second patient: an AI-generated list page polled every 30s. The readings contradicted each other, 368 to 1,630 renders per 60s (the overlay’s RAF and settle waves polluting the counts). Counts screen, data flips explain. So a payload-diff spy: subscribe to the react-query cache, snapshot the rendered fields per fetch.
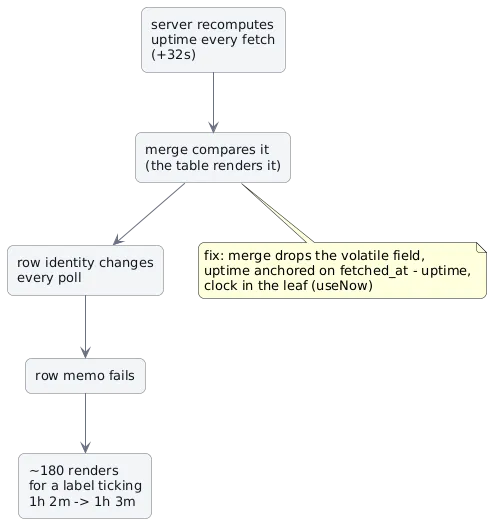
Figure 2. One volatile field, one render wave. The merge compares what the server recomputes; every poll re-renders what did not change.
Well, it pinned the truth: exactly one field moved per poll. The uptime, +32s every fetch, because the backend recomputes it from the process start, so it ALWAYS differs. The merge had to compare it (the table renders it), so every poll adopted fresh rows, the row memo failed, and the whole filter-bar + table subtree, roughly ~180 renders, re-rendered for a label moving from “1h 2m” to “1h 3m”. Like clockwork, which is precisely the problem.
The fix: keep the volatile payload, stop rendering the raw field. Stamp the fetch time into the row, anchor the uptime on fetched_at − uptime, let a clock in the leaf (useNow, 30s, visible-tab only) advance the label; same for “last seen X ago” via date-fns’ constructDateFrom symbol hook. The merge drops the volatile field, unchanged rows keep identity, and the wave collapses.
| Metric | Before | After |
|---|---|---|
| Idle renders per 60s | 1,460 | 10 |
| Isolated 70s gate | — | 3 commits / 15 renders, all clock-leaf ticks, zero table renders |
| Page-open window | 2,740ms total / 90ms self | 2,291ms total / 83ms self |
| Poll wave per 30s | ~180 renders | 0 |
The moral: a field the server recomputes on every fetch is not data, it is a clock, and clocks belong in the leaf that shows them. Note who wrote both halves of this mess: the AI wrote the churn, and left alone it would have “fixed” it by memoizing the wrong thing, with great confidence. Only the data pinned it.
Packaging the loop as a skill
The loop lives in a SKILL.md plus scripts the agent runs verbatim: plugin setup, probe, measure.sh, validity gates, and the rule that fixes are judged by render-time delta. Every gotcha above is encoded, so nobody, human or agent, pays it twice. The agent must ship before/after numbers in the commit message, ms first, counts second. No numbers, the fix does not exist. The whole skill goes below, verbatim.
In my humble opinion, that numbers rule is worth more than any prompt: it is the one thing the machine cannot argue with. And the instrument that makes it possible, the probe, the scripts, the skill itself: the agent built every line of them, because I told it that measuring was a precondition for trusting its own fixes.
One more thing. I built this on a personal project, built to a professional standard. The results were promising enough that I now run the same loop at work.
That is how AI code gets optimized: not smarter prompts but a measuring stick plus a rule the machine cannot argue with. Voila.
The skill, sanitized
This is the actual SKILL.md my agent runs. It took years to pay for itself:
---
name: react-rerender-perf
description: 'Detect and fix React re-render storms, render loops, page flashes, and slow chat/list pages using react-scan measurement (render counts AND actual render time via fiber.actualDuration) and the identity/memo/dedupe fix ladder; render time is the objective, counts are the proxy - memo overhead can cost more than it saves. Use when the user reports a page flickers/flashes/gets shown on open, components re-render continuously, the UI is slow to render or janky, renders-per-second numbers, asks to profile React performance, or mentions react-scan, StrictMode double effects, or memoization. Also use before claiming a React perf fix works - always measure time before and after.'
---

# React re-render perf: detect and fix

Workflow: measure first, fix one cause at a time, re-measure, commit each fix with numbers. Never "fix" perf by intuition, the numbers decide.

## 1. Set up a dev-only profiler (react-scan)

Install as devDependency. Gate it so it can NEVER ship to production:

```ts
// vite.config.ts — only when dev server runs (scanEnabled = process.env.SCAN !== "false")
import reactScanPlugin from "@react-scan/vite-plugin-react-scan";

command === "serve" && scanEnabled
  ? [
      reactScanPlugin({ enable: true, scanOptions: { enabled: false } }),
      { name: "dev-react-scan-probe", /* serve-only /dev-probe.js middleware */ },
    ]
  : [],
```

Gotchas learned the hard way:
- `autoDisplayNames: true` makes react-scan's own display-name Babel pass rewrite JSX on top of the app's Babel JSX transform → `Cannot access '_jsx' before initialization`. Keep it false (it is the plugin default).
- Peer conflicts: `@react-scan/vite-plugin-react-scan` peers vite ≤6 while the project is on 7, resolve with npm `overrides`, not by downgrading vite.
- The scan UI hijacks app JSX. Instrument headless instead: a serve-only vite middleware at `/dev-probe.js` that imports react-scan, calls `scan({ enabled: true, showToolbar: false })`, then `setOptions({ enabled: false })`, and exposes the module as `window.__perfScan`.
- Verify the prod build is clean: `grep -c ReactScanInternals dist/assets/*.js` must be 0.

## 2. Measure with a fixed window

Arm counters via `onCommitStart`/`onRender` callbacks, count AND time for a fixed window (12s), read JSON out. Reusable script: `scripts/measure.sh` (Maestri portal driver; adapt the browser driver to playwright/CDP if no portal). Core pattern:

```js
import('/dev-probe.js').then(() => {
  const rs = window.__perfScan;
  window.__C = { commits: 0, renders: 0, byName: {}, ms: {}, msSelf: {} };
  rs.setOptions({ enabled: true, showToolbar: false,
    onCommitStart: () => window.__C.commits++,
    onRender: (fiber, renders) => {
      const t = fiber && fiber.type;
      const n = (t && (t.name || t.displayName)) || (typeof t === 'string' ? t : '?');
      const c = (renders && renders.length) || 1;
      window.__C.renders += c; window.__C.byName[n] = (window.__C.byName[n] || 0) + c;
      // render TIME: fiber.actualDuration is React's real render clock
      // (Scheduler.unstable_now, the same field the DevTools Profiler reads).
      // onRender fires inside onCommitFiberRoot, BEFORE React swaps the
      // double-buffer — fiber.alternate may hold the NEWER tree. Pick the
      // later actualStartTime (bippy's getLatestFiber heuristic), else ms
      // silently reads the previous commit or clamps to 0.
      const a = fiber.alternate;
      const latest = (a && a.actualStartTime && fiber.actualStartTime &&
        a.actualStartTime > fiber.actualStartTime) ? a : fiber;
      const total = latest.actualDuration || 0;
      window.__C.ms[n] = (window.__C.ms[n] || 0) + total;
      let self = total, ch = latest.child;
      while (ch) { self -= ch.actualDuration || 0; ch = ch.sibling; }
      window.__C.msSelf[n] = (window.__C.msSelf[n] || 0) + Math.max(self, 0);
    }});
});
// ... wait 12s, then setOptions({enabled:false}) and read window.__C
```

Timing caveats (all verified against react-scan 1.2.0 / bippy 0.3.34 / react-dom 19.2):
- **`actualDuration` is only populated by a React development or `react-dom/profiling` build**, plain prod builds never write it. The hook itself is installed by bippy at probe import; that is necessary but NOT sufficient. Validity gate: force one real interaction and require `Object.values(window.__C.msSelf).some(v => v > 0)`, `__REACT_DEVTOOLS_GLOBAL_HOOK__.renderers.size` only proves a renderer injected, not that durations exist.
- **Arming is state-sensitive.** `setOptions({enabled:true})` unpauses instrumentation, but the user `onRender` also requires the inspect state not to be inactive; if callbacks fire yet counts stay 0, re-navigate and re-arm (there is no reliable "armed but silent" state to recover from).
- **Deltas, not absolutes.** Profiling cost is React's own `ProfileMode` work (set unconditionally on the root in dev, `performance.now()` around every begin/end work) plus react-scan's post-commit fiber walks. An instrumented app is slower than the same app uninstrumented. Never compare instrumented ms against a human-perception threshold; compare instrumented-before vs instrumented-after, same window, same page.
- **Use `msSelf` (self time) to pick the fix target**, not total, total double-counts up the tree (parent total includes children). Component with the biggest `msSelf` is where the milliseconds are actually spent. Caveat: the self loop subtracts every direct child's `actualDuration` including host fibers, so self can clamp at 0 (silent undercount) for components whose time sits in host children. Treat a clamped 0 as "not the target", not as "no cost".
- **Counts and ms disagree, that is the point.** 45k row renders × 0.005 ms = 0.2 s of real work; 200 renders of one fat table × 4 ms = 0.8 s. Optimize the ms, tick down the count only when it costs nothing.
- **Counts are the screening tool, ms is the verdict.** Render counts are cheap, low-noise, near-deterministic: use them to FIND candidates (idle nonzero = a loop; top component names = where to look; count ratio before/after = did the mechanism change at all). ms is noisy (instrumentation overhead, GC, thermal, tab state) so it needs 2-3 runs and medians before it can PROMOTE or reject a fix. Workflow: screen with counts, decide with ms.

### The memo-overhead tradeoff (why time is the objective, not count)

`memo()`, `useMemo`, `useCallback` and deep-compares are not free: every update pays a props shallow-compare (or a hand-written deep-compare over dates/nested arrays), and the deps arrays themselves allocate. For a cheap leaf rendered a handful of times, compare cost can EXCEED the render it skips: the memo makes the app slower while the render counter looks better. Rules:

1. **Judge a memo fix by Δms, not Δrenders.** After adding `memo()`, re-measure the same interaction window: `msSelf` of the subtree must go down. If renders drop but ms is flat or up, the compare is eating the savings, un-memoize or move the fix up (identity-preserving state, rung 3, which costs one cheap equality check per item and skips the whole subtree).
2. **Deep-compares are the usual offender.** A per-item deep-compare over a 1,254-message list with nested trace arrays runs on every websocket tick; keep it only when it protects an expensive subtree (markdown body, chart row). Measure the compare itself: time the merge function in a unit test loop, or temporarily replace it with `===` and re-measure the window.
3. **Idle churn is exempt from the tradeoff.** Nonzero renders at idle are pure waste regardless of how cheap each one is (wakeups, timers, socket handlers); drive idle to 0/0 counts first (counts-only gate, idle ms is too small and noisy to gate on), then tune ms on the interaction windows.
4. **Interaction latency is the headline number.** Report `ms` summed over the open/interaction window as THE before/after metric in the commit message, with counts as the supporting number.

Measure THREE windows, not one:
1. **Open sequence**, right after navigation (includes legit one-time mount of every visible component).
2. **Steady idle**, 12s after open settles. This is the loop detector: healthy app = 0 renders / 0 commits at idle. Any nonzero idle count is a bug.
3. **Repeat navigations**, run 2-3×. First run may include login/permission warm-up; don't mistake warm-up for steady state.

Record `top` component names, they point straight at the culprit.

Hidden-tab caveat: react-scan's `onRender`/`onCommitStart` can go inert when `document.hidden === true` (non-primary renderer), so an idle-0 reading in a background/portal tab may be a false negative, not a healthy page. Check `document.hidden` before trusting an idle window; confirm idle-0 in a visible tab when the verdict matters.

Validity gate before trusting ANY count: force a known-real interaction (open+close a select, click a tab) and confirm commits moved. A stale counter (common after repeated reloads) reads 0/0 like a healthy page, full navigate + re-arm fixes it.

Counter saturation: the headless probe's tree-walk floor means small re-renders (identical-array setState vs fresh-array setState) read ~the same. For small-N fixes the discriminating signals are (a) a fiber `PerformedWork` walk, (b) a render-count probe in a unit test (count child renders across a re-render with unchanged props), (c) state-identity assertions (dispatch a volatile-only update, assert the state array is the identical reference). Keep the counters for storms.

Hidden portals also pause polling: `refetchInterval` gated on `document.visibilityState` stops firing when the tab is occluded, after-state live measurement can be blocked exactly when the fix works. Fallback: discriminating unit tests (temporarily remove the fix, watch the test fail) are acceptable evidence; say so in the commit body.

## 3. Classify the pattern

| Signal | Cause |
|---|---|
| Idle window nonzero, top = leaf list items | Parent re-renders continuously and items aren't memoized, or props change identity each render (unstable callback props are the sneaky one, see fix ladder rung 2) |
| Idle nonzero, top = many different components | State/provider churn at the root (react-query refetch, auth identity object churn, locale switch, socket reconnect) |
| Open sequence renders ≈ visible items × N | N full re-renders of the list, one per state bump (each fetch/replay/identity change). If counts scale ×N but `msSelf` does not, the items are cheap, deprioritise |
| Double network/handler calls per page load | React 19 StrictMode `doubleInvokeEffectsOnFiber` re-runs effects, dev-only, production unaffected. Confirm via stack: `reconnectPassiveEffects<-doubleInvokeEffectsOnFiber` |
| Flash of wrong content on open | Locale/theme/data seeded AFTER first paint, seed it before render or gate first paint |
| Big list mounts all items but few visible | Missing windowing/virtualization, an open-sequence `msSelf` fix: dominated by mounting off-screen items (separate fix: react-virtuoso etc.) |
| Open/settled page burns RAF every frame, `scroll` events = 0, scrollTop stuck | Virtualizer scroll-reconcile wake loop: sync `scrollTop` writes (flushSync-on-measure) interrupt a smooth scroll, so the reconcile loop never sees a stable frame and re-arms forever. @tanstack/react-virtual: fix with `anchorTo` matching where the list actually opens + `useFlushSync:false` + `followOnAppend`. Gate = RAF armed BEFORE the probe; counts alone can read 0/0 while the loop runs |
| Commits only at poll boundaries (e.g. every 30s), each one a wave of ~150-200 renders over the whole list subtree, payload "changed" | Volatile-field poll wave: the backend recomputes a field on every fetch (server-side uptime, last-seen fallbacks) so the payload ALWAYS differs; the identity merge must compare it (page renders it), so every poll adopts fresh rows and the row memos fail. Confirm with a payload-diff spy: subscribe to the query (`cache.subscribe`), snapshot the rendered fields per fetch, diff, exactly one field moving by the poll interval is the signature. Fix: keep the volatile payload (sorting may need it) but render the label from a stable anchor + a leaf clock, then drop the field from the merge compare; see fix ladder rung 3b |

Sentry/monitoring will NOT show re-render loops, they're not errors. Only a render profiler sees them.

## 4. Fix ladder (apply one at a time, re-measure each)

1. **`memo()` leaf components**, message items, list rows, anything rendered per item. Cuts parent-driven re-render counts (~-50% measured); confirm with Δ`msSelf`: renders down but ms flat/up means the compare eats the savings (memo-overhead tradeoff rule 1).
2. **Stable callback props, memo is worthless if the parent hands every row a fresh function each render.** A `useCallback` that captures an unstable object (identity-provider data, react-query results, router state) gets a new identity whenever that object churns, so every memoized child's shallow compare fails. Measured in a real codebase: one unstable message-processing prop re-rendered all ~1,280 message rows per websocket tick (17k-45k row renders per chat turn) even after memo + identity-preserving merges had landed. Fix: capture the *pinned* per-id object (rung 5) in callback deps, not the raw provider object; or pass a ref-stable dispatcher (`useEvent`-style) down. Detect it by counting renders of one memoized row while the parent re-renders: if the row renders, a prop identity is dying; log prop pairs to find which.
3. **Identity-preserving state updates, the biggest win.** When replaying/deduping a list (websocket history, polling, react-query refetch), compare each incoming item against the existing one; if equal, KEEP THE OLD OBJECT. Copy the array lazily (only once a real change is found) and bail `setState` entirely when nothing changed:

   ```ts
   let newList; let hasChanges = false;
   for (const m of incoming) {
     const prev = list[indexOf(m.uuid)];
     if (prev && isSame(prev, transform(m))) continue;   // keep old identity
     if (!newList) newList = [...currentList];
     newList[i] = transform(m); hasChanges = true;
   }
   return hasChanges ? newList : currentList;  // caller: hasChanges ? setState : skip
   ```

   Write a real deep-compare for your item shape (dates, nested arrays; a naive `===` on Date fields that are recreated per call always mismatches). Memo only works if identity survives. Choose compared fields PER CONSUMER: volatile fields the page doesn't render (heartbeats the label ignores) can be excluded to freeze identity; fields the page DOES render must participate or the label goes stale forever, UNLESS the label itself is made a clock (rung 3b), which is how a field the backend recomputes on EVERY fetch (server-side uptime) gets both: it never stops differing, so keeping it in the compare means a full-subtree re-render wave on every poll. Comment the why.
4. **Clock-in-the-leaf for volatile labels**, when a rendered field is a server-side recomputation that changes on every fetch (uptime seconds, "last seen" rewritten by a fallback), do NOT keep it in the identity compare; render it from a stable anchor on the leaf's own ticking clock instead. Pattern: (a) stamp the fetch time into the row client-side (a `fetched_at` field, INSIDE the row so it survives react-query structural sharing and the identity merge); (b) leaf component = a clock hook + `format((now - anchor)/1000)` where `anchor = fetched_at - uptime*1000`, memoized, so a tick re-renders the leaf only; (c) relative-time labels take an optional `now` from the clock: date-fns `formatDistanceToNow` has no base-date option, but `constructNow(date)` honors `Symbol.for("constructDateFrom")` on the input date, define it (own property shadows the prototype lookup) to return the clock instant when called with the raw `Date.now()` number (the symbol fires for EVERY date the function constructs, only redirect the number call). Verify the hook's behavior in-page with a throwaway probe test before trusting it, and verify expectations against date-fns' own rounding.
5. **Stable props/keys**, data providers hand down a fresh user object every render; memoize per-id: keep the FIRST object reference while `String(user.id)` is unchanged (`useRef` + `useMemo`). Use the stable value in all subscription keys, effect deps, AND the deps of every `useCallback` whose result flows into a memoized child (see rung 2, pinning the object is half the job; the callbacks must capture the pinned one). react-admin gotchas: `useTranslate()` returns a fresh function identity per render, so `useMemo(..., [translate])` rebuilds every parent render (row memos absorb it, but pin it with `useCallback` if the memo must actually hit); `useList`'s controller result is a fresh object every render and its data effect JSON-round-trips rows, row memos inside it never bail without a memoized hand-built context.
6. **Seed late-arriving state before paint**, locale/theme from the profile: write it into the store (e.g. `RaStore.set('locale', …)`) inside `getIdentity` only when the store is empty or still equal to the last seeded value, so explicit user choice wins.
7. **Server-side dedupe of replays**, if the double-call is dev StrictMode, leave the client alone (prod unaffected) and make the SERVER cheap instead. Build it on the framework's own membership truth (socketio `manager.rooms` / `server.rooms(sid)`), it self-cleans on disconnect (the library's disconnect handler leaves all rooms): on re-enter without leave, skip the expensive replay (e.g. a 1,254-message, ~78KB payload) and return nothing/empty, and genuine re-joins always get fresh data. Only if the framework truth is unavailable, hand-roll a per-sid record, then clear it on leave AND disconnect, and key it as a SET of rooms, not a single slot: one socket can join several rooms, and a single-slot record silently un-suppresses the first room's replay whenever a second room overwrites it.
8. **Window/virtualize long lists**, only if the open sequence is dominated by mounting items that aren't visible. Also consider gating collapsed rows: a collapsed system message that still mounts its full markdown body pays the parse+render cost for content nobody sees; render the body only on expand.

## 5. Verify

- Before/after per fix, same window, same page, 2-3 runs. Numbers go in the commit message: **ms first** (sum of `msSelf` over the window, and per-culprit component), counts second. A fix that cuts renders but not ms is not a fix, see the memo-overhead tradeoff.
- Steady idle must reach 0 renders / 0 commits (counts gate; idle `msSelf` should be non-increasing too, but do not gate on it, instrumentation noise swamps idle-scale ms).
- E2E the dedupe semantics: first enter gets full data, same-sid re-enter gets nothing, leave+re-enter gets full data again. A python-socketio (or playwright) probe script beats trusting logs.
- Full unit suite + typecheck after each fix.
- Verify the fix is actually in the served bundle: `curl -s http://localhost:5173/src/hooks/useX.ts | grep -c <new-symbol>`.
- A/B without branch gymnastics: `git show <fix>~1:file > /tmp/old.ts`, cp current aside, cp old in (vite HMR picks it up), measure, restore.
- Force the rare trigger instead of waiting for it: find the QueryClient in the fiber tree (`#root` → `__reactContainer$…` key → BFS for `fiber.memoizedProps.client.getQueryCache`; React 19 dev has no `__reactFiber$` on `#root` and `dependencies.context` does NOT hold it), then `invalidateQueries(['auth','getIdentity'])` to reproduce identity churn on demand.
- Audit premises go stale: verify the claimed state of the code (was that component actually memoized?) before fixing; read the component, not the audit row.
- A RAF spy is contaminated by the probe itself: react-scan's overlay re-schedules `requestAnimationFrame` unconditionally once `scan()` has run (~120-160/s in broken AND healthy builds). Arm the RAF spy BEFORE importing the probe, or use commits/renders only. Steady-idle gates must be visible-tab: hidden tabs throttle timers to ~1/s and can read 0/0 over a live wake loop.
- Intermittent loops need a discriminating gate, not one clean run: the measured broken build sometimes settled fine on rerun (timing-dependent collision); the invariant was the RAF loop with zero scroll events.

## 6. Debug-instrumentation hygiene

Heavy instrumentation (prints, per-event logger.info with dict dumps) is fine while hunting, but it poisons measurement (I/O noise) and lies after hot-reload (module identity changes, stale dicts). Before committing: grep the touched files for `print(`/`console.log` and remove. When a guard "never fires" under hot-reload, restart the process cleanly and retest before rewriting it, stale-module artifacts are real. A long-running backend can hold a PARTIAL stale module after file edits (a running process predating a commit may fail with `module has no attribute <new symbol>` while a fresh import works), restart, then retest, before chasing a phantom bug.

## Batch-fixing a whole pattern class

Audit once, then one agent per finding, sequential: paste the audit row (file:line, pattern, trigger) + this skill's measurement recipe into each prompt; require measure-before/after in Δ`msSelf` plus counts, unit test, own commit per item; timebox live-browser attempts to ~10 min and fall back to discriminating unit tests when the portal is hidden/disconnected. Instruct agents: never `git add -A`, no push, no amend, `--no-verify` only for verified pre-existing hook failures.
To conclude…
AI writes the code; the loop decides what survives. Counts find the suspects, milliseconds pass the verdict, and the browser tab must be visible. The agent does all of it, but only because you gave it the loop. As for now there is no absolute answer on thresholds, so do your own benchmarks.
That’s all folks!
Feel free to comment or contact me if you had like.