You need to compare strengths and weaknesses of products, services, or even companies, you want to compare skills or follow a temporal evolution? There is a simple app for that: this one!
This third major version mainly focus on user experience while working on your phone.
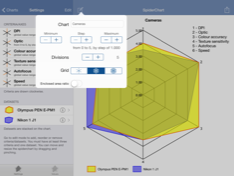
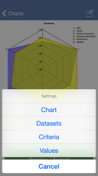
• Customize your grid
Choose to display: no grid, polygons, circles, choose how many divisions to show on grid.
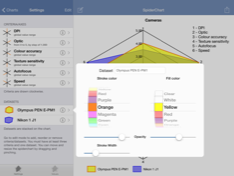
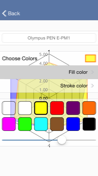
• Customize your datasets (elements to be compared)
Choose the stroke and fill color, along with the stroke width.
Create as many as you need (but have at list one)
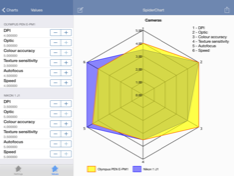
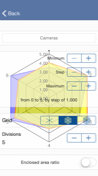
• Create as much criteria / axis as needed
The only limit is having at least three.
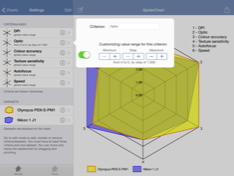
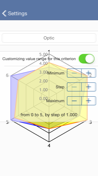
• Use the desired scale
You can change minimum and maximum values, the step between allowed values, globally, or on a criterion by criterion basis (asked by a user).
• See what you are doing!
While customizing your chart, datasets, criteria and changing values you always see your spider chart.
• Stay synced
Your data stay up-to-date on your multiple devices using iCloud.
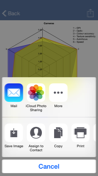
• Final preview before export (on your phone only)
Zoom and scroll on your chart to check everything is alright before exporting it.
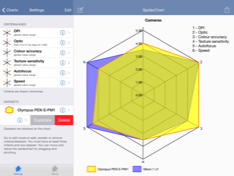
• Is it hard to determine which of the compared element is best?
Enable the enclosed area ratio to display a value between 0 and 1 indicating how much a dataset is filling the chart (asked by a user).
This application is currently localized in:
- English
- French
- German
- Spanish
- Japanese
- Chinese